Deploy Observability Locally
The observability stack provides access to metrics and logging for your workloads. This guide walks through the installation and usage of observability with Threeport.
Prerequisites
You'll need a local Threeport control plane for this guide. Follow the Install Threeport Locally guide to set that up.
You'll also want to deploy a workload to get metrics and logs for. Follow the Deploy Workload Locally guide to deploy a sample WordPress app.
Note: for this guide, you will need to have kubectl installed at this time.
Configs
First, create a work space on your local file system:
1 2 | |
Download a sample workload config as follows:
1 | |
You now have the config for an observability stack on your file system. This is what it looks like.
1 2 3 4 5 6 7 8 9 10 11 12 13 14 15 | |
The commented fields indicate how the observability stack can be customized, but that is outside the scope of this guide. We're going to deploy it with the default settings.
The only change you should make is to set the KubernetesRuntimeInstance.Name
field. Get the name of the K8s runtime instance/s you have available with this
command:
1 | |
Create Observability Stack
This command will create all the observability stack components:
1 | |
Give Threeport a few minutes to get all the stack components up and running.
You can use this kubectl command to determine when the observability dashboard is up and running.
1 | |
When the output shows STATUS: Running like this, you can proceed.
1 2 | |
Connect to the Dashboard
When running locally, you can connect to the observability dashboard as follows.
First get the namespace for the dashboard:
1 | |
Then, create a port forward to allow you to connect to the dashboard locally:
1 | |
Now visit http://localhost:3000 in your browser.
This should bring you to the Grafan login. Enter admin for the username and
password for the password.
Metrics
On the left, click on the hamburger menu and navigate to Dashboards then Kubernetes / Compute Resources / Pod.
At the top of the dashboard, you can select the namespace and pod for which to view metrics.
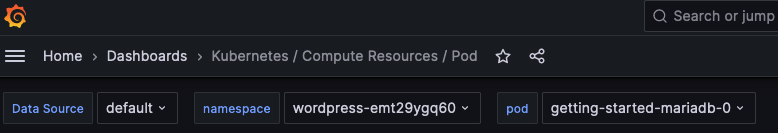
Select the namespace with the wordpress- prefeix and one of the pods for that
application. You can view CPU and memory usage, among other metrics, on this
page for the workload.
Click "Home" at the top-left of the screen.
Logs
To get logs for the WordPress app, click the hamburger menu next to "Home" at the top-left of the screen. Then select Connections > Data sources from the menu.
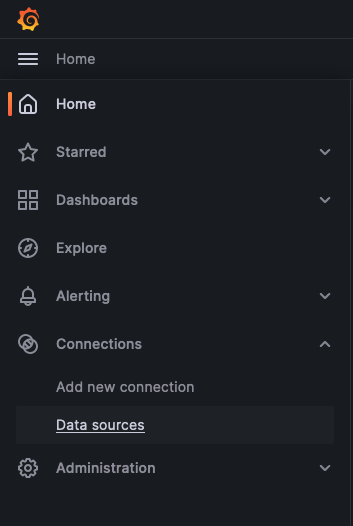
On the Data sources page, click "Explore" on the loki data source.

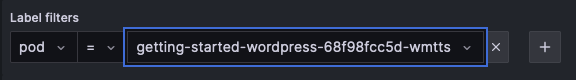
On the Explore page, under "Label filters" select "pod" from the "Select label" menu and select the "getting-started-wordpress" pod from the "Select value" menu.
Now, click the blue "Run query" button at the top-right of the screen.
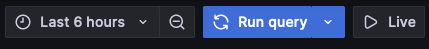
You'll now be able to view the logs from the WordPress application.
Remove Observability Stack
You can now hit ctrl-c to on the port forward to terminate it.
The observability stack can be uninstalled with the following command.
1 | |
Clean Up
Finally, we can remove the files we downloaded.
1 2 | |
Summary
In this guide we walked through how to install the observability stack and then use the dashboard to get basic metrics and log output from the sample Wordpress application.